netdata
Vendor: netdata
Netdata delivers real-time, AI-powered full stack observability for infrastructure and applications, offering deep insights with minimal resource consumption for lean teams.
Official Preview
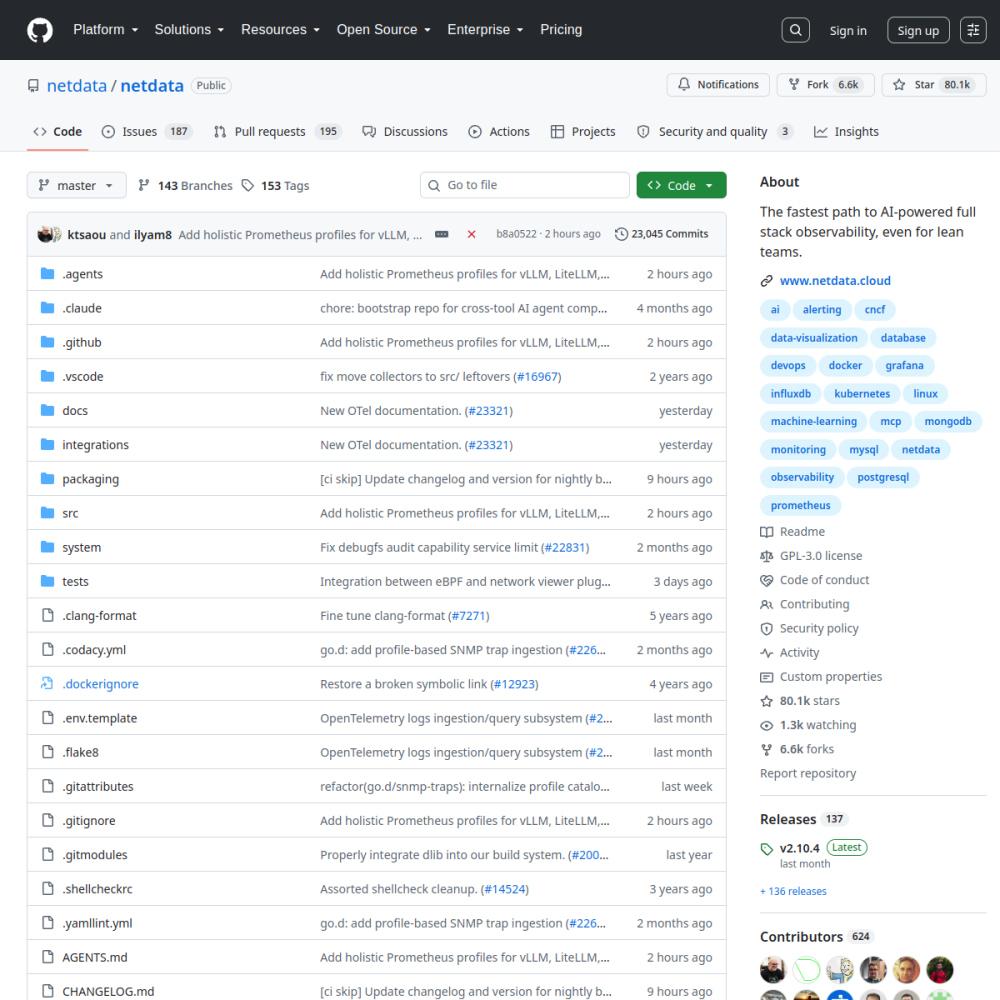
Vendor: netdata
Netdata delivers real-time, AI-powered full stack observability for infrastructure and applications, offering deep insights with minimal resource consumption for lean teams.
| Repository | netdata/netdata |
|---|---|
| GitHub Stars | ★ 80.3k |
| Forks | 6.6k forks |
| Primary Language | Go |
| License | GPL-3.0 |
| Technical Domain | OTHER |
$ git clone https://github.com/netdata/netdata.git && cd netdata
Netdata positions itself as a comprehensive observability platform designed to provide immediate visibility into system performance and application health. It targets DevOps teams and infrastructure engineers who require granular data without the overhead of traditional monitoring stacks. The project emphasizes speed and efficiency, making it suitable for environments where resource conservation is critical.
Core capabilities include real-time metric collection, automatic chart generation, and built-in alerting mechanisms. The platform supports a wide array of integrations, including Kubernetes, Docker, Prometheus, and various databases like PostgreSQL and MongoDB. Its architecture allows for auto-discovery of services, reducing the manual configuration typically associated with monitoring tools.
A key highlight is the minimal resource footprint, allowing it to run on constrained hardware while still delivering high-resolution data. However, users seeking extensive enterprise-grade compliance features or complex multi-tenant management might find the ecosystem less mature than commercial alternatives. The interface is designed for quick troubleshooting rather than long-term trend analysis alone.
Typical deployment scenarios involve monitoring Linux servers, tracking container orchestration metrics, and visualizing application performance indicators. Teams often utilize it to gain instant feedback on infrastructure changes or to diagnose latency issues in real-time. The inclusion of AI-driven insights further assists in identifying anomalies before they impact service availability.
Netdata positions itself as a comprehensive observability platform designed to provide immediate visibility into system performance and application health. It targets DevOps teams and infrastructure engineers who require granular data without the overhead of traditional monitoring stacks. The solution aims to simplify complex monitoring requirements for technical teams.
The project emphasizes speed and efficiency, making it suitable for environments where resource conservation is critical. It delivers real-time, AI-powered full stack observability for infrastructure and applications, offering deep insights with minimal resource consumption for lean teams. This approach ensures that monitoring does not become a bottleneck in production systems.
Typical deployment scenarios involve monitoring Linux servers and tracking container orchestration metrics. Teams often utilize it to gain instant feedback on infrastructure changes or to diagnose latency issues in real-time. This immediate feedback loop is essential for maintaining system stability.
Another primary use case is Kubernetes cluster performance tracking and application-level metric visualization. The platform supports a wide array of integrations, including Docker, Prometheus, and various databases like PostgreSQL and MongoDB. These integrations allow for a unified view of the technology stack.
The inclusion of AI-driven insights further assists in identifying anomalies before they impact service availability. This capability supports machine learning topics and enhances the standard monitoring workflow. Proactive detection helps prevent downtime before users notice issues.
Deployment is supported across Linux environments and containerized setups via Docker. The architecture allows for auto-discovery of services, reducing the manual configuration typically associated with monitoring tools. This reduces the time required to get initial metrics flowing.
Once deployed, the platform provides real-time metric collection and automatic chart generation. Users can access built-in alerting mechanisms immediately after installation to begin tracking system health. The setup process prioritizes speed to ensure rapid visibility.
A key highlight is the minimal resource footprint, allowing it to run on constrained hardware while still delivering high-resolution data. The interface is designed for quick troubleshooting rather than long-term trend analysis alone. This makes it ideal for immediate diagnostic tasks.
Users seeking extensive enterprise-grade compliance features or complex multi-tenant management might find the ecosystem less mature than commercial alternatives. The overall rating stands at 4.5 out of 5 across functionality, documentation, activity, and ease of use. These scores indicate a high level of user satisfaction with the core features.
Typical integration scenarios involve visualizing application performance indicators alongside infrastructure metrics. It works alongside tools like Grafana and InfluxDB within broader observability stacks. This flexibility allows teams to incorporate it into existing workflows.
The project is recognized within the CNCF landscape and supports topics ranging from machine learning to database monitoring. While specific enterprise adoption numbers are not detailed, the tool is widely recognized for lean team efficiency. It serves as a viable option for organizations prioritizing resource efficiency.
netdata is an open-source AI project developed primarily in Go under the GPL-3.0 license. Netdata delivers real-time, AI-powered full stack observability for infrastructure and applications, offering deep insights with minimal resource consumption for lean teams.. Netdata positions itself as a comprehensive observability platform designed to provide immediate visibility into system performance and application health. It targets DevOps teams and infrastructure engineers who require granular data without the overhead of traditional monitoring stacks. The solution aims to simplify complex monitoring requirements for technical teams. The project emphasizes speed and efficiency, making it suitable for environments where resource conservation is critical. It delivers real-time, AI-powered full stack observability for infrastructure and applications, offering deep insights with minimal resource consumption for lean teams. This approach ensures that monitoring does not become a bottleneck in production systems.
Deployment is supported across Linux environments and containerized setups via Docker. The architecture allows for auto-discovery of services, reducing the manual configuration typically associated with monitoring tools. This reduces the time required to get initial metrics flowing. Once deployed, the platform provides real-time metric collection and automatic chart generation. Users can access built-in alerting mechanisms immediately after installation to begin tracking system health. The setup process prioritizes speed to ensure rapid visibility.
netdata is well-suited for Real-time server health monitoring, Kubernetes cluster performance tracking, Application-level metric visualization. With an overall rating of 4.5/5, it offers strong community activity, reliable performance, and easy integration with existing AI pipelines.
A key highlight is the minimal resource footprint, allowing it to run on constrained hardware while still delivering high-resolution data. The interface is designed for quick troubleshooting rather than long-term trend analysis alone. This makes it ideal for immediate diagnostic tasks. Users seeking extensive enterprise-grade compliance features or complex multi-tenant management might find the ecosystem less mature than commercial alternatives. The overall rating stands at 4.5 out of 5 across functionality, documentation, activity, and ease of use. These scores indicate a high level of user satisfaction with the core features.
Minimal tool for running large language models locally